Case study: Consolidation of enterprise tools
The opportunity and challenge: DAT’s customer-facing teams utilize a wide array of customer databases, including Salesforce and Tableau, as well as internal tools such as DAT Rep, Product Usage Dashboard, and CSR (Customer Support Rep) pages. The number of different tools to reference, with sometimes conflicting data, forced DAT employees to constantly “swivel chair” across numerous data sources and take too much time to research while talking to customers.
The company: DAT, shorthand for “Dial A Truck,” is the largest freight matching load board in North America, connecting millions of brokers, shippers, and carriers daily to find partners shipping freight across the continent, 365 days a year.
The business proposal: Primary goals were twofold: 1) There was a business need to migrate legacy databases off the CSB, which hosted aging engineering architecture. 2) Customer-facing representatives were forced to spend too much time cross-referencing data while meeting with customers. Consolidating data into one internal platform would save DAT’s reps and customers both valuable time.
My role: Lead researcher and designer, starting with discovery work to understand existing user flows and needs, ending with high-fidelity new designs and protoypes for dev implementation.
The users: DAT’s internal, customer-facing teams, including:
Enterprise Sales
Customer Success
Customer Support
Compliance
Timeframe and tools
Project kicked off in January 2024, and went live in August 2024.
Figma
LucidChart
Jira
Legacy tools including DAT Rep, Project Usage Dashboard, and CSR Pages
New and improved enterprise software
With the redesign and consolidation of tools, new visual data was added and organized in a cleaner format requiring fewer total clicks or scrolling.
Discovery phase: What are the problems?
The problems with the existing platforms were plentiful. There were more than half a dozen different tools being utilized across various teams, with sometimes conflicting customer info. DAT employees spent extra time cross-referencing at least four different legacy products as well as Salesforce, Tableau, and BI tools.
When interacting directly with customers, time = money, and minimizing total time spent for reps reviewing customer data and reducing minutes spent on the phone with customers saves the business money, as well as mitigates customer time, effort, and potential frustration.
Legacy tools: Varying layouts and search filters


The legacy databases, including CSR (or Customer Support Rep) pages, Product Usage Dashboard, and DAT Rep all contained some overlapping customer information, making it cumbersome for internal support, compliance, and sales reps to quickly find necessary information and serve customers with ease.
All of the tools offered different layouts and information architecture, so this added to the “context switching” each internal employee was needing to spend time adjusting to throughout the day.
“The biggest pain is trying to get a holistic customer view using 7 different tools.”
Workshop focus: Meet with stakeholders from impacted internal teams
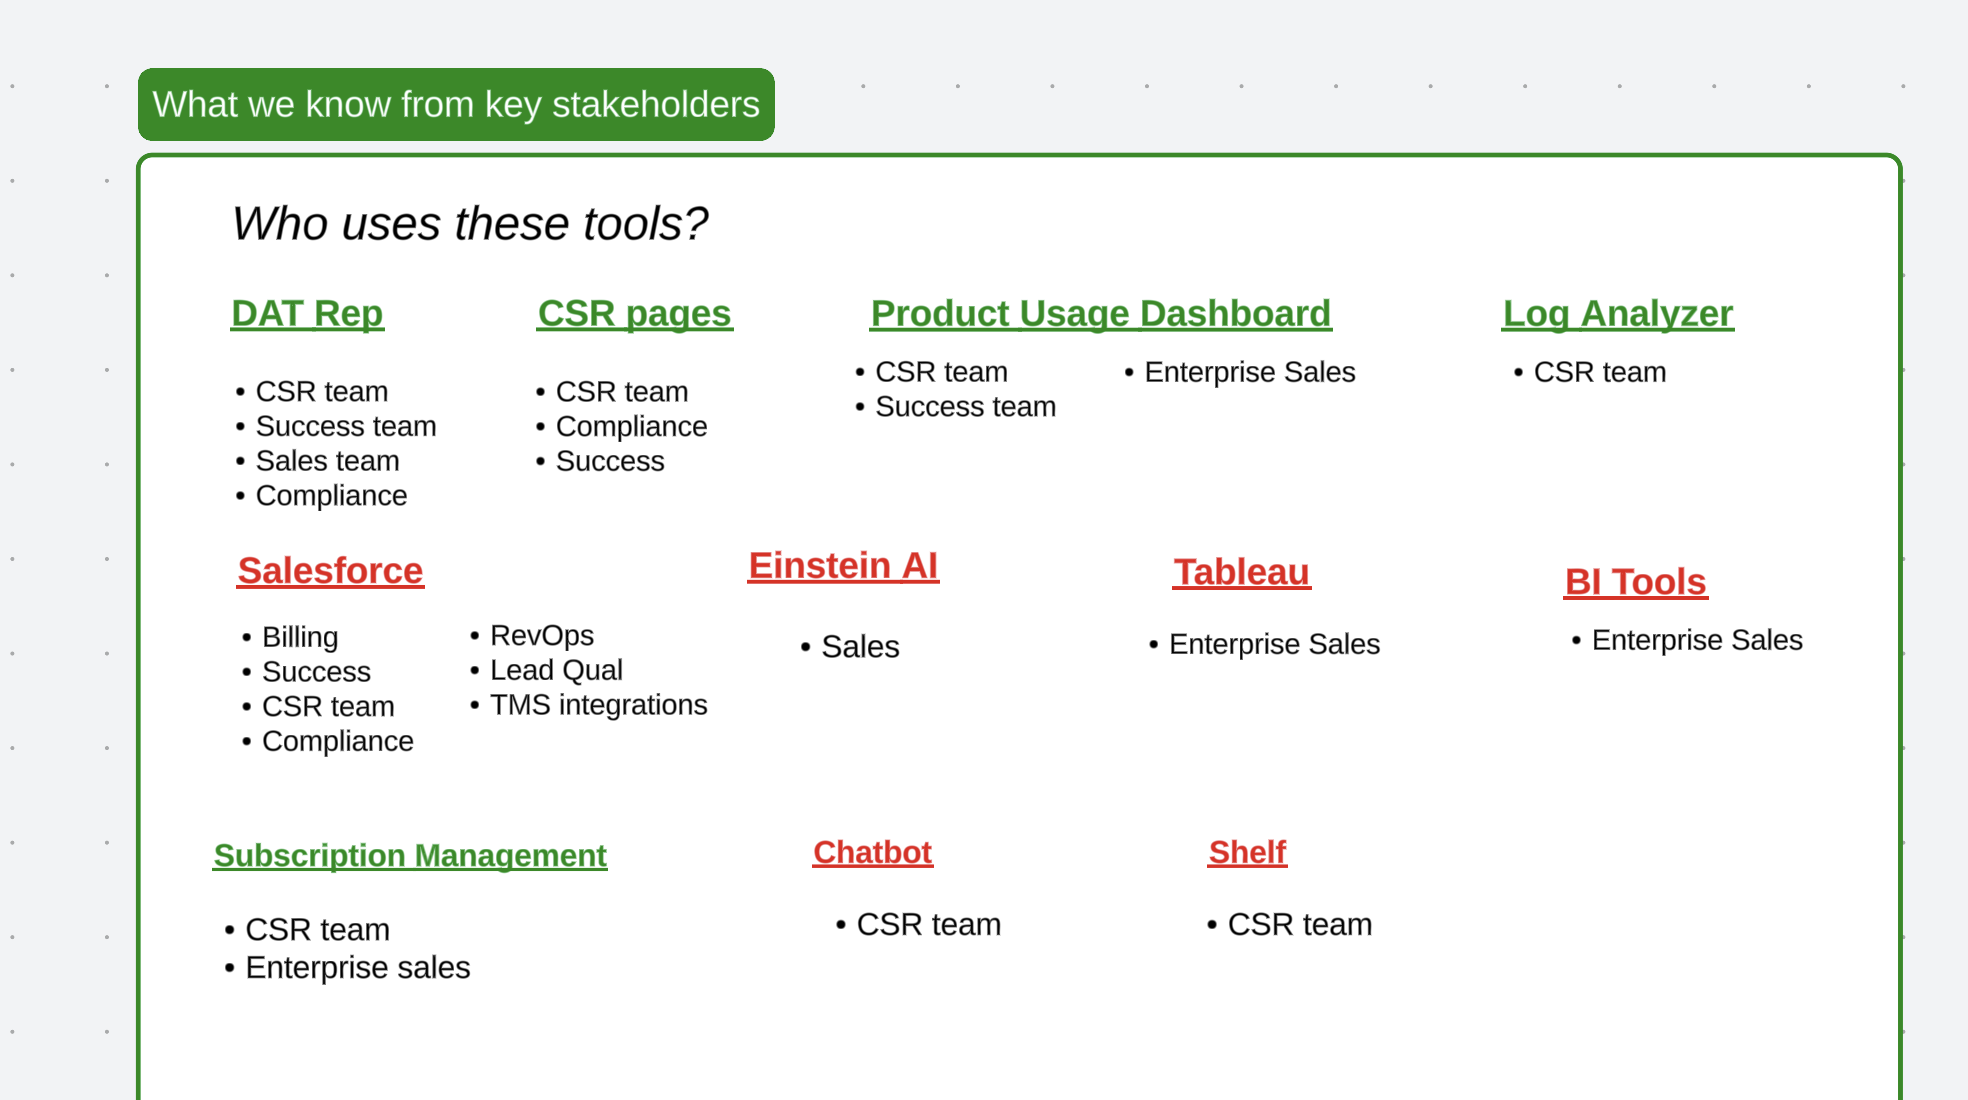
I conducted multiple workshops and interviews with four key internal DAT teams actively utilizing these databases to understand their usage and workflows, respective pros and cons to using each tool, and created journey maps to get a better holistic understanding and paint a picture of their user experience.
I included my partners in product management, UX research, and engineering in these sessions to bring them along in the journey and capture their knowledge and perspectives.
One of the biggest design challenges was to come up with an elegant, streamlined final solution that would minimize effort for all internal teams with different needs and priorities, valuing different information.


Solution: Consolidate databases into DAT Rep
Instead of maintaining three internal customer databases, we decided to combine all three into one tool.
Eliminate the need to maintain legacy products and aging engineering architecture, reducing latency issues.
Considering all existing tools, DAT Rep provided the best infrastructure to build off of as the base tool, with the most up-to-date, branded interface and best engineering architecture.
Add data visualization and more intuitive interface navigation into DAT Rep for better usability and less scrolling.

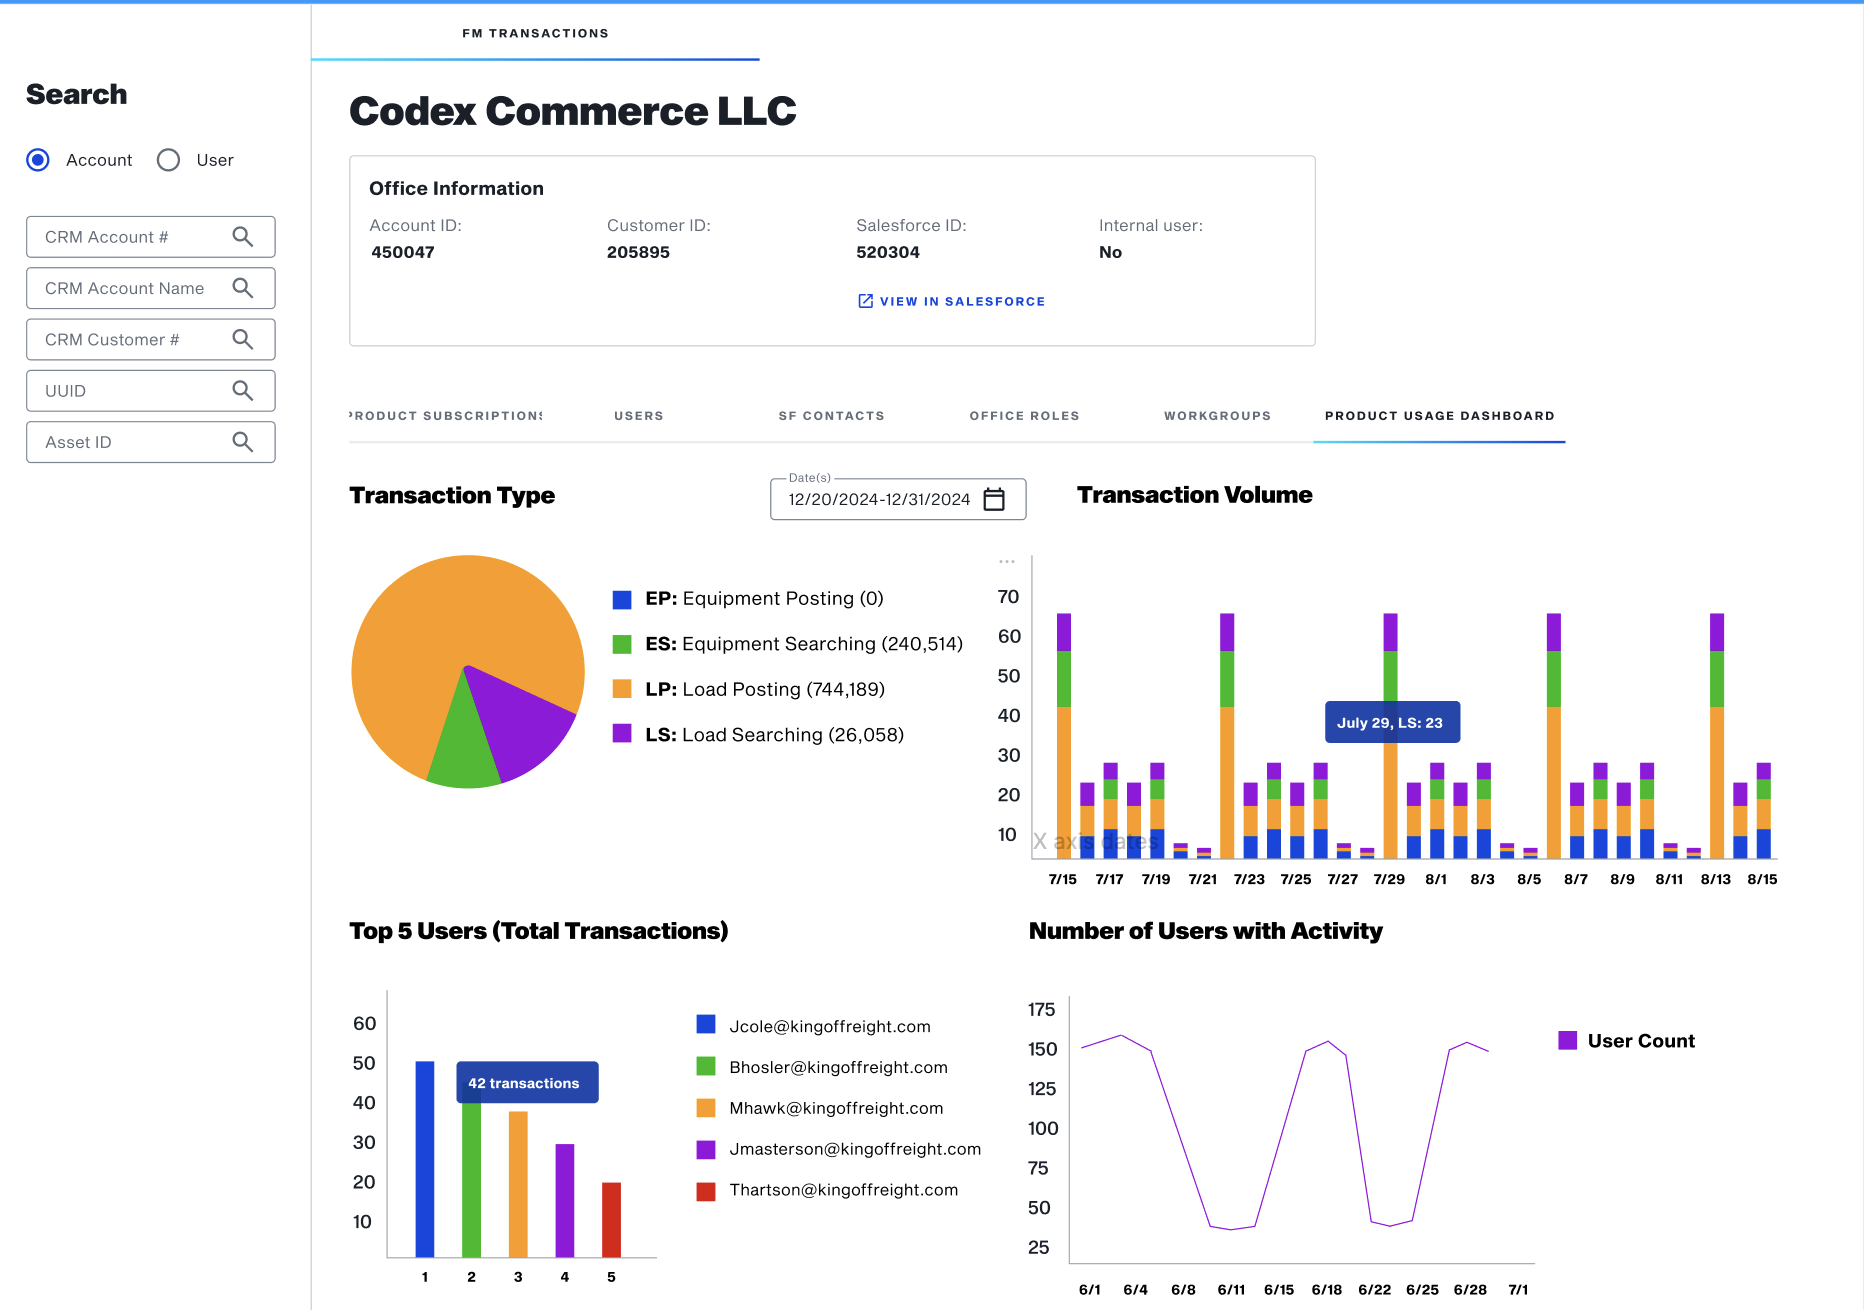
Early design stage wireframing: I transported high-level sketch ideas for a new design solution into low-fidelity wireframes conveying a new concept for bringing transaction and usage charts from the Product Usage Dashboard into a holistic dashboard on DAT Rep. Added functionality included searching directly for transactions on this dashboard at either an account or individual user level.

Iterative enhancements
With the overall concept for the page design coming into shape, I iteratively upgraded levels of fidelity to utilize our design system components, making the new dashboard more aligned with our company-wide branding and familiarity with components and styling.
The new charts would be built in code with JavaScript amCharts.
User feedback: Since the users of these tools were internal DAT employees, I regularly touched base with our four primary stakeholder teams to review design progress and to gauge how effectively the new designs might be meeting their needs. As part of these iterative improvements, I made adjustments to the search filter options and dropdowns based on their usage needs, balanced with development feasibility to launch an MVP build by end of Q3.

Getting closer to pixel perfect.
As I worked with the Product Manager and development team to build out the designs, I made design tweaks based on feasibility, for example including hover states as user tabbed over charts to display granular information, and the ability to modify the date ranges to render different visualizations.
I also used existing design patterns from the customer-facing products such as our table styles and “expanded rows” utilizing screen, wide monitor screen space more effectively.
Final solution and results for MVP: The development team was able to build out the MVP version of the new and improved DAT Rep experience ahead of schedule, launching in August 2024. This release was met with a positive reception by the impacted stakeholders, expressing gratitude for an improved day-to-day workflow experience.
The new version accomplished the original project goals of:
Cleaning up the company’s database architecture and migrating off the CSB, a critical business engineering deadline and goal for 2024.
Reducing the amount of different tools required to reference on a daily basis, as well as context switching.
Streamlining the tool’s interface, implementing existing design patterns and componentization across all DAT platforms for better ease of use.
Adding data visualization and functionality into DAT Rep, creating more of a “one-stop shop” for representatives to access each day.